If you’ve ever pulled up your company profile and felt unsure what you’re looking at, you’re not alone. A lot of people can see the numbers, but don’t really know how to read CSA scores in a way that helps them take action.
Here’s the good news: once you understand what the system is measuring and how it ranks carriers, it gets much easier to read CSA scores confidently, and spot what needs attention. CSA data comes from roadside inspections and crash reports (and can also reflect investigation results), and it’s used to help prioritize interventions for carriers that may pose higher safety risk.
Table of Contents
CSA Score Breakdown
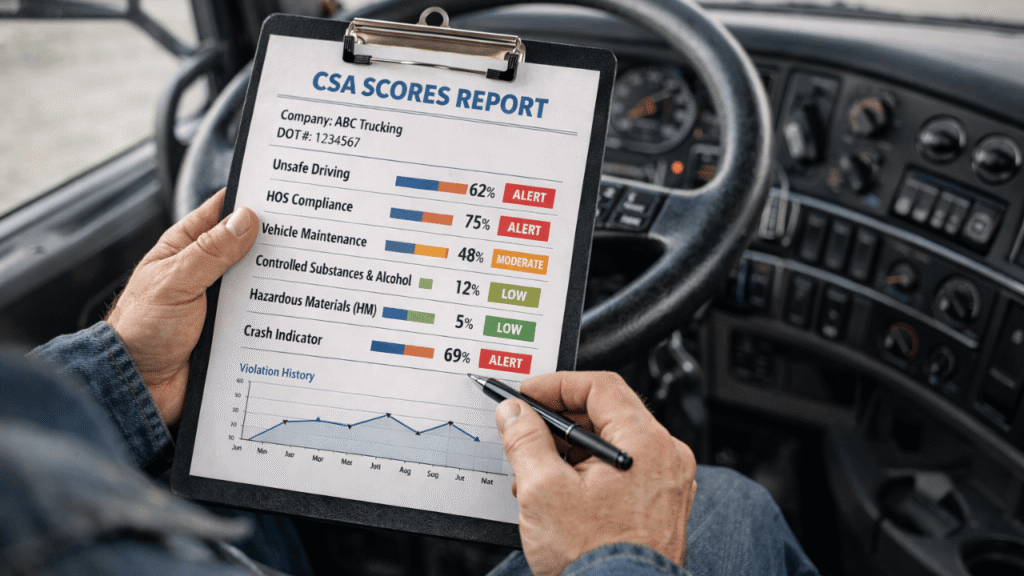
Your CSA view is usually organized by safety areas and shown as a percentile ranking. A key detail many people miss: the Safety Measurement System ranks carriers against peers with similar numbers of safety events and assigns a percentile from 0–100—higher percentile generally means worse performance.
When you’re learning to read CSA scores, focus on:
- Which areas have the highest percentiles
- Whether the trend is improving or getting worse
- How many inspections are driving the result (one bad inspection can sting if you have low volume)
BASIC Categories
CSA is grouped into different “buckets” (often called BASICs) based on types of violations and safety events. You don’t need to memorize every detail to read CSA scores well, just understand that each bucket represents a different kind of risk, and each one can be prioritized differently depending on what’s showing up in your data.
A practical tip: pick the top one or two buckets causing the most trouble and work them first. Trying to “fix everything” at once usually means nothing changes.
SMS Percentile
Percentiles are where people get tripped up. A percentile isn’t a “grade” like 80% on a test, it’s a rank compared to similar carriers. That’s why two carriers with different violation counts can still look similar if they’re being compared within different peer groups.
Also, recent violations matter more. FMCSA applies time weighting so newer inspections carry more impact than older ones (for example, the most recent period can be weighted more heavily than violations that are closer to aging out).
If you want to read CSA scores like a pro, always ask: “Is this problem current, or is it aging off?”
Safety Rating
CSA/SMS data and an official safety rating are not the same thing. Safety ratings (like Satisfactory, Conditional, or Unsatisfactory) come from FMCSA’s safety fitness evaluation process and reflect safety management controls and compliance.
Why it matters: a carrier can have ugly percentiles but not have a changed rating, and a carrier can also face serious consequences if a rating drops. So when you read CSA scores, treat them as an early-warning dashboard, not the final verdict.
Violation Impact
Not all violations hit the same. Some carry higher severity and can weigh down a BASIC more than others. Add the fact that newer violations are weighted more, and you can see why one rough inspection can move the needle fast, especially for smaller fleets.
A simple way to use read CSA scores in day-to-day operations:
- Review the inspection report the same week it happens
- Identify which violations repeat across drivers or terminals
- Fix the root cause (training, maintenance process, dispatch pressure, documentation)
How to Read CSA Scores Step by Step
When you sit down to read CSA scores, use this quick routine:
- Start with the highest percentile area (your biggest risk signal).
- Look at inspection count (low volume = bigger swings).
- Check recency (newer events carry more weight).
- Identify the repeat pattern (same violation type? same driver group? same lane?).
- Assign one owner and one fix (clear accountability beats vague goals).
Do this monthly, and you’ll read CSA scores with a lot more confidence.
How to Read CSA Scores and BASIC Percentiles
If you want the short version: percentiles tell you how you compare to similar carriers in each BASIC area, and higher percentiles usually mean you’re closer to intervention thresholds.
That’s why the smartest fleets don’t just watch the number, they watch what’s creating it.
Understanding CSA SMS Scores for Trucking Companies
For trucking companies, SMS is best treated as a management tool. It’s built to measure safety performance using inspection and crash data over time, with more emphasis placed on recent behavior.
When you learn to read CSA scores consistently, you stop reacting and start controlling the outcome.
Turn Your CSA Data Into A Simple Plan
The goal isn’t to obsess over every point. The goal is to read CSA scores often enough that nothing surprises you, then fix the few things that are actually driving your risk. With regular reviews, coaching, and clean maintenance/documentation habits, the numbers usually follow.
Want Help Improving Your CSA Picture?
Reach out to us at www.welocity.ca, call 905-901-1601, or email info@welocity.ca if you need any trucking-related services. Whether it’s compliance support, driver coaching, or inspection readiness, we have you covered.